Management Indices
Consolidated
(%)
| 2021/3 | 2022/3 | 2023/3 | 2024/3 | 2025/3 | |
|---|---|---|---|---|---|
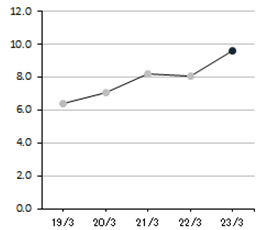
| Ratio of operating income to net sales | 8.2 | 8.1 | 9.6 | 8.9 | 9.5 |
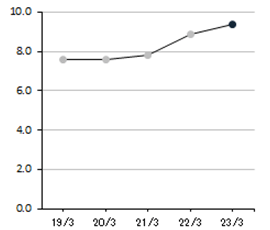
| Return on assets (ROA) | 7.8 | 8.9 | 9.4 | 8.7 | 8.6 |
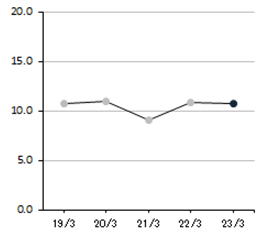
| Return on equity (ROE) | 9.1 | 10.9 | 10.8 | 9.6 | 9.6 |
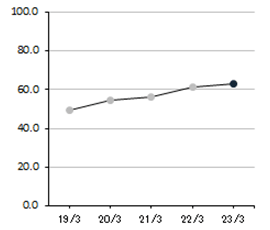
| Capital adequacy ratio | 56.3 | 61.0 | 63.0 | 65.9 | 65.7 |
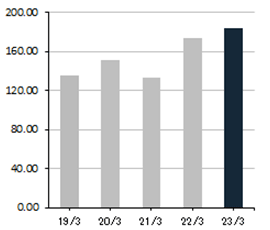
| Earnings per share (EPS) [Yen] | 132.84 | 173.22 | 183.97 | 177.97 | 189.94 |
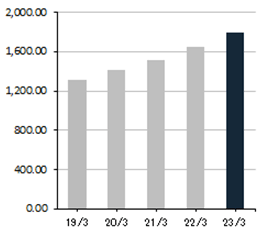
| Book value per share (BPS) [Yen] | 1,519.63 | 1,647.64 | 1,797.63 | 1,906.82 | 2,035.54 |
Ratio of operating income to net sales
(%)
Return on assets (ROA)
(%)
Return on equity (ROE)
(%)
Capital adequacy ratio
(%)
Earnings per share (EPS)
(Yen)
Book value per share (BPS)
(Yen)
